Discovery findings
Discovery findings represent sensitive data candidates discovered using discovery rules which can be then checked and manually marked as sensitive or not sensitive data. This process requires an executed discovery to have data to check and mark.
| Contents |
|---|
| Discovery Findings Overview List |
| Advanced options |
| Expand Sample Data |
| Needs Review or Does not need Review |
| Mark Finding as Miss |
| Mark Finding as Hit |
| Edit Note |
| Delete Finding |
| Reporting |
Discovery Findings Overview List
If there are no discovery findings, the Discovery Findings Overview List is empty. The discovery findings are the result of the executed discoveries.
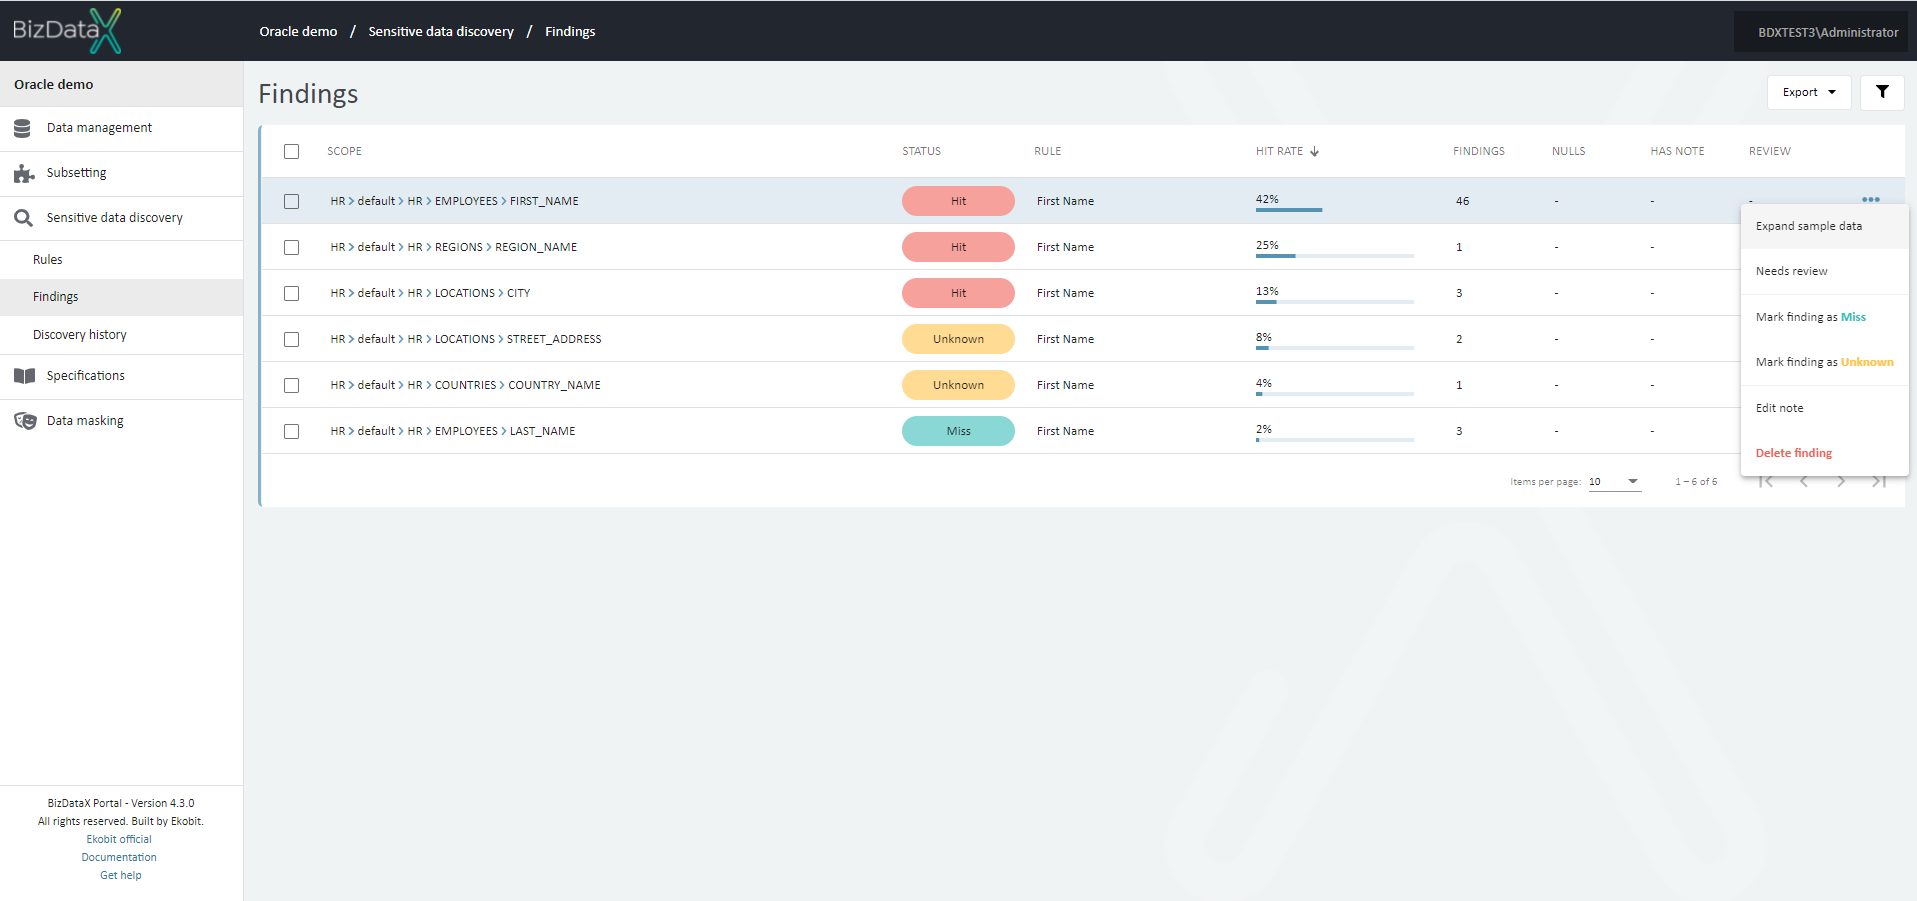 Figure 1: Discovery Findings Overview List
The default mode to display the discovery findings is the View mode. The mode can be controlled with the yellow Edit mode button in the upper right corner (Edit mode / View mode).
In View mode, the following options are available for each record:
- Expand single discovery finding - with a click anywhere on the record, the row will be expanded and additional data about the record will be shown.
- Expand sample data - get sample records by frequency to allow fast decision about sensitivity. Red values are sensitive, black are not sensitive data.
- Needs review/Doesn't need review - mark the record for additional discussion.
- Delete finding - use checkboxes to delete more than one discovery finding at once.
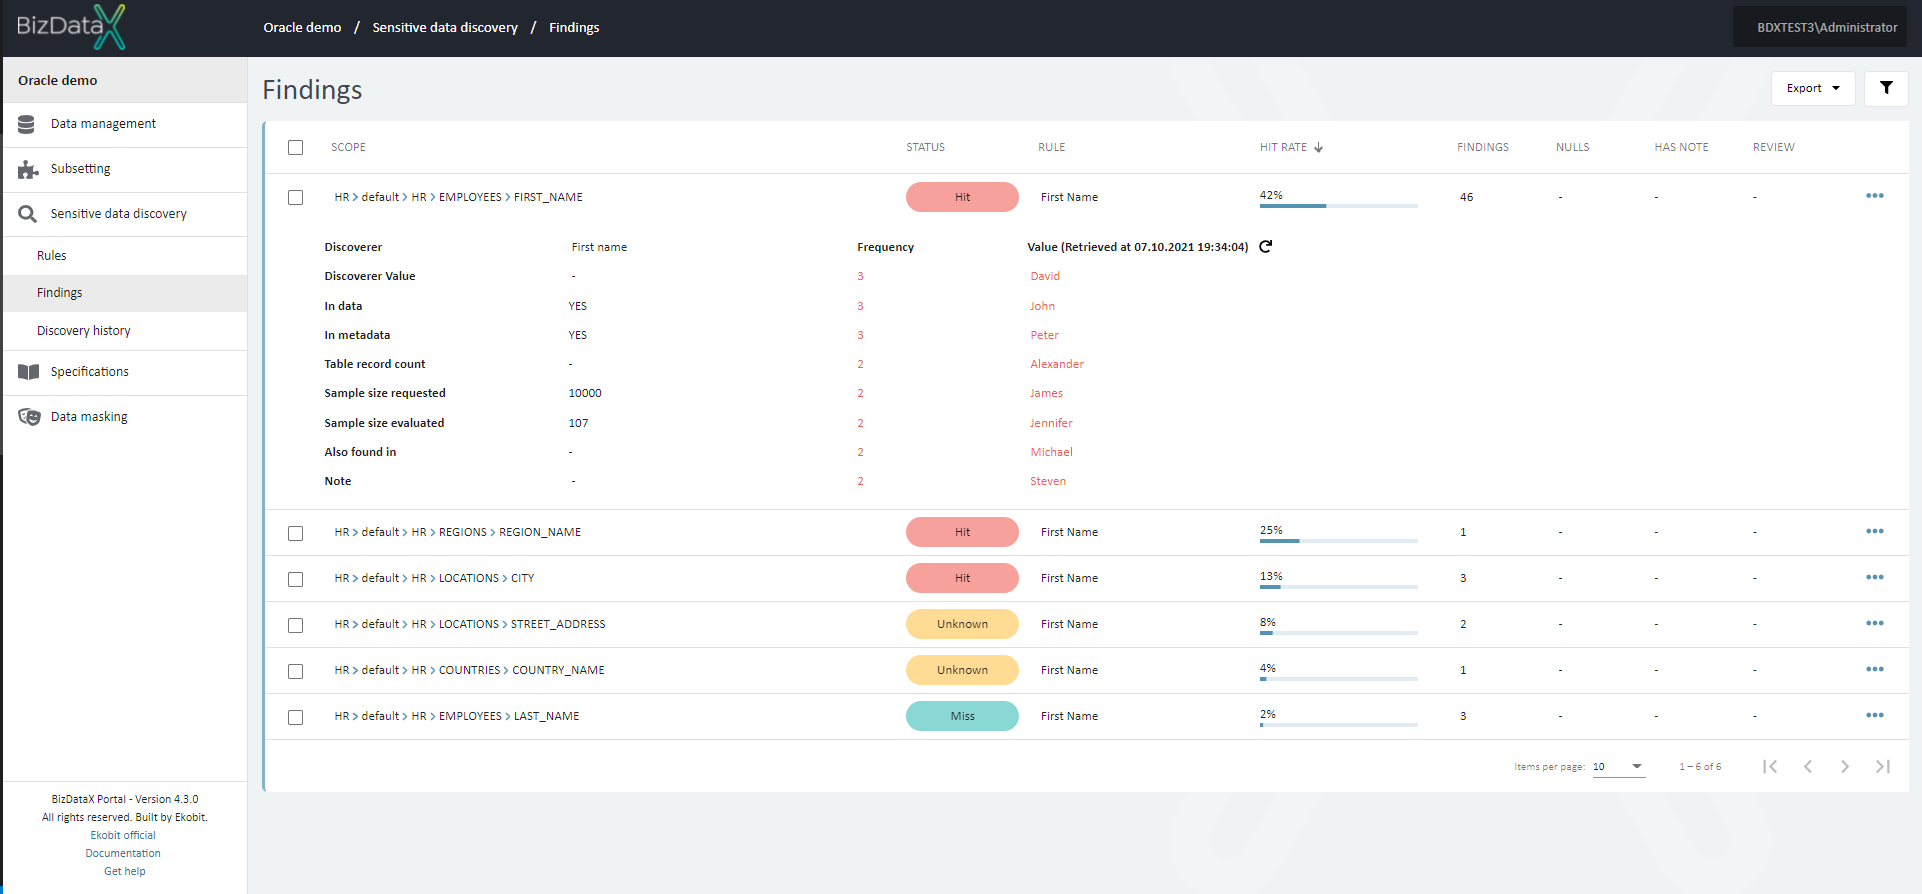 Figure 2: Discovery finding expanded
Advanced options
On right upper corner there is the Advanced options button, where you can filter the displayed data.
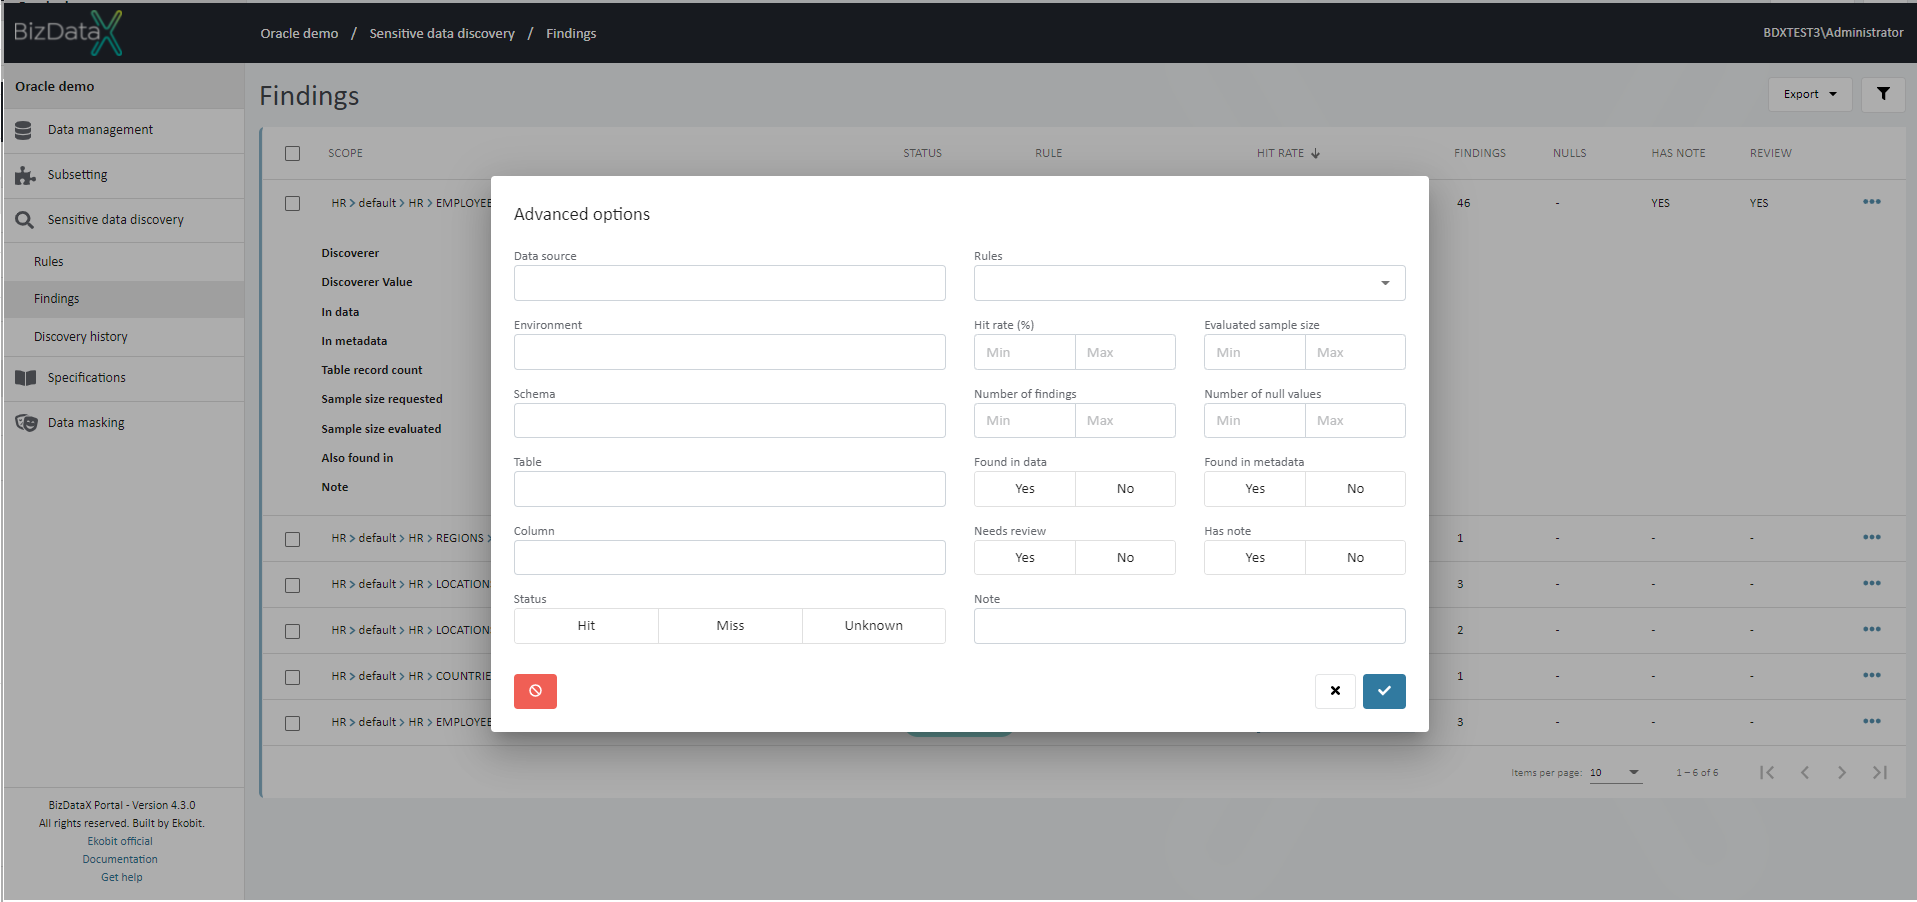 Figure 3: Advanced options
User can choose options to filter data in the overview:
- Data source - name of Data source
- Environment - name of Environment
- Schema - name of Schema
- Table - name of Table
- Column - name of Column
- Status - possibility to choose:
- Hit - Findings with status 'Hit'
- Miss - Findings with status 'Miss'
- Unknown - Findings with status 'Unknown'
- Rules - name of Rule
- Hit rate - possibility to define:
- Min - minimum hit percentage in search range
- Max - maximum hit percentage in search range
- Evaluated sample size - possibility to define:
- Min - minimum evaluated sample size in search range
- Max - maximum evaluated sample size in search range
- Number of findings - possilibity to define:
- Min - minimum number of findings in search range
- Max - maximum number of findings in search range
- Number of null values - possibility to define:
- Min - minimum number of null values in search range
- Max - maximum number of findings in search range
- Found in data - possibility to choose:
- Yes - Finding exists because data are potentially sensitive
- No - Findings don't exist
- Found in metadata - possibility to choose:
- Yes - Finding exists because metada indicates that data are potentially sensitive
- No - Findings don't exist
- Needs review - possibility to choose:
- Yes - review is needed
- No - review is not needed
- Has not - possibility to choose:
- Yes - Finding has a note
- No - Finding doesn't have a not
- Note - Finding note
To clear all inserted filters in Advanced options, choose Clear button.
To apply inserted filter data in Advanced options, choose Commit button. A filtered data view will be displayed in the table.
To cancel changes in Advanced options, choose Cancel button.
Expand Sample Data
As a result of expanding one record, additional data will be shown:
- In data - if YES, discovery finding exists because data are potentially sensitive.
- In metadata - if YES, discovery finding exists because metadata (e.g. name of the column) indicates that data are potentially sensitive.
- Table record count - number of records in the table where discovery finding is detected.
- Sample size requested - sample size defined in the discovery rule.
- Sample size evaluated - number of data checked in the discovery process (the number is same as Sample size requested if the table contains more records as Sample size requested, else contains a number of records in a table).
- Found in - lists other rules where this column is recognized as potentially sensitive.
- Data sample - top 5 example records by frequency to allow fast decision about sensitivity. Red values are sensitive, black are not sensitive data.
- Frequency - how often the value occurs.
- Retrieved at - last data reach moment from the database (data can be refreshed).
- Note - note.
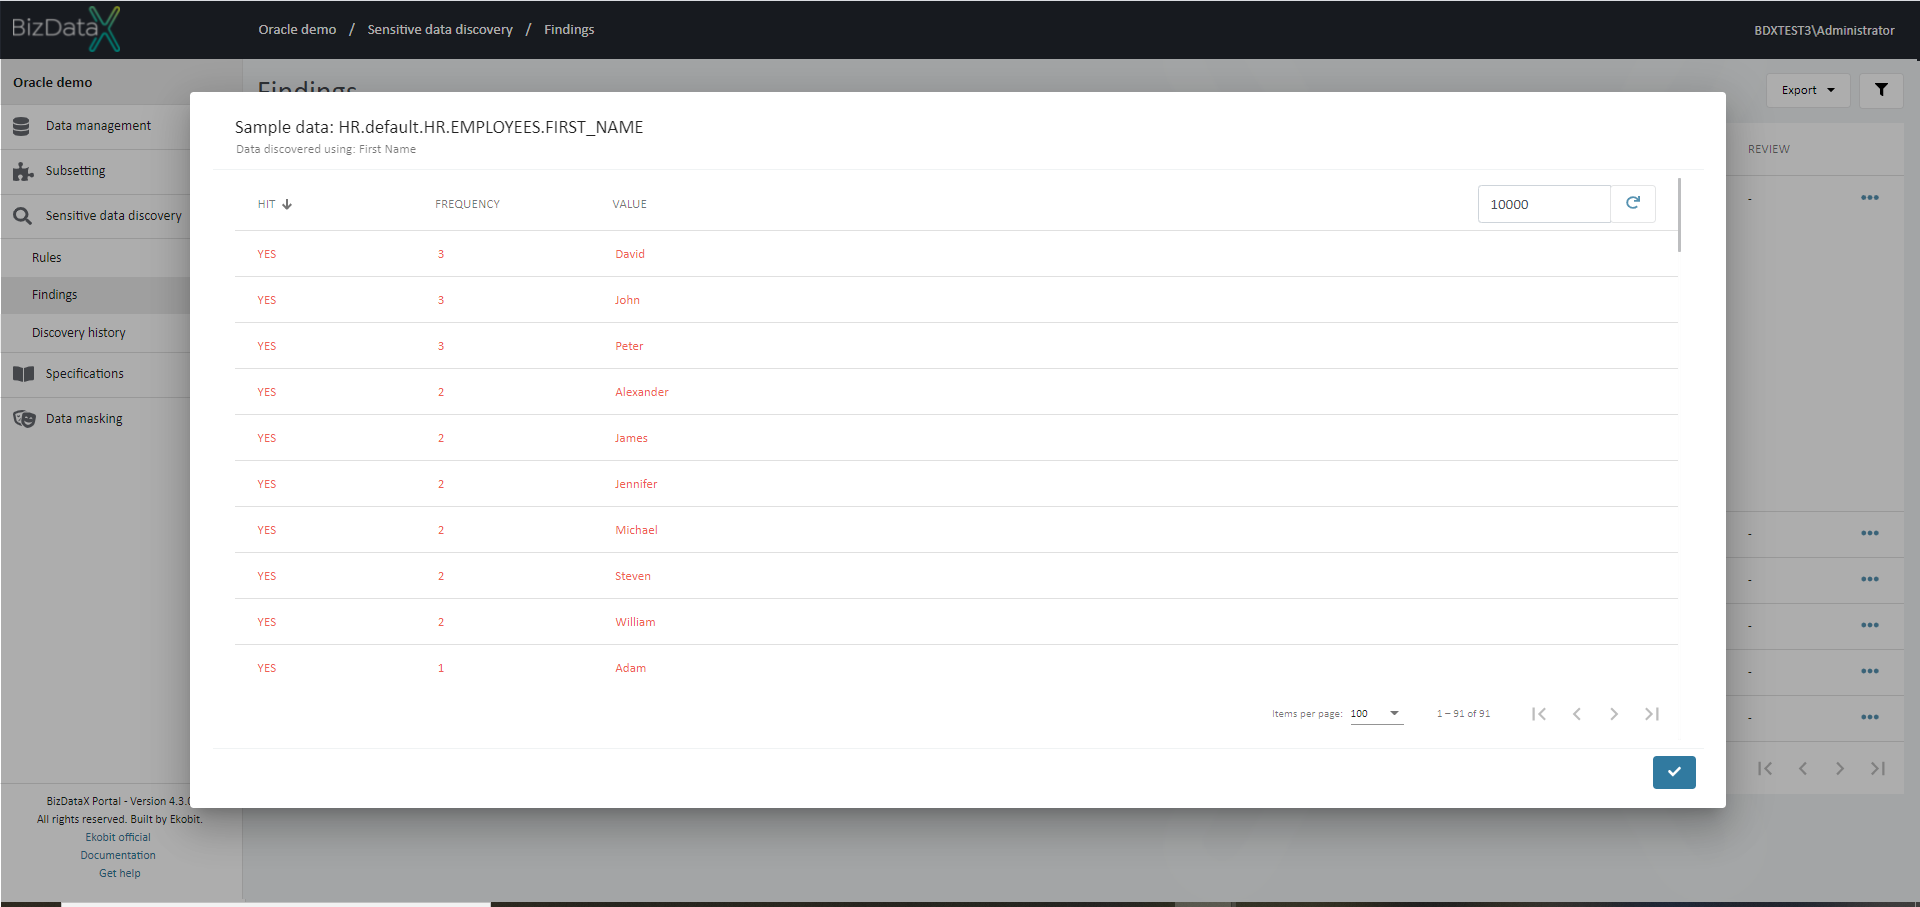 Figure 4: Expand Sample Data
Needs Review or Does not need Review
This option will mark Finding that it needs Review or not.
Mark Finding as Miss
This option will mark Finding as 'Miss'.
Mark Finding as Hit
This option will mark Finding as 'Hit'.
Mark Finding as Unknown
This option will mark Finding as 'Unknown'.
Edit Note
There is possibility to enter some note for selected finding.
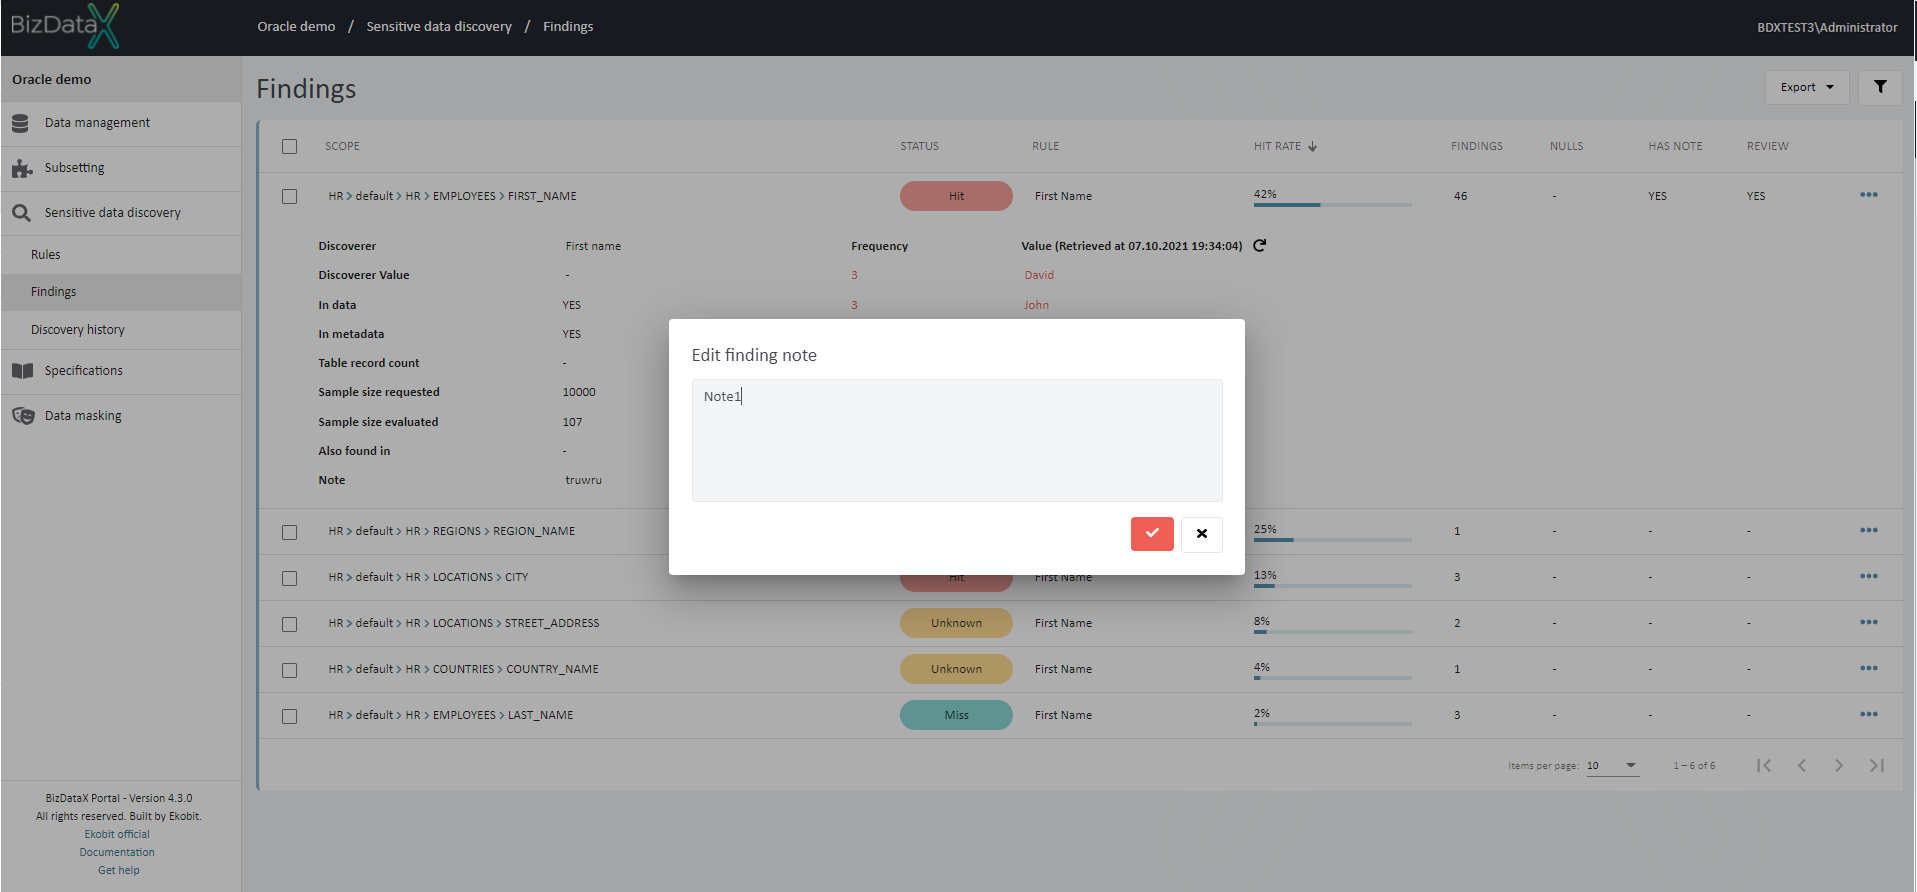 Figure 5: Edit Note
Delete Finding
If Discovery Finding is no needed user can select on Discovery Finding overview list one or more Findings, by using checkboxes, to Delete it. A confirmation message appears before deleting.
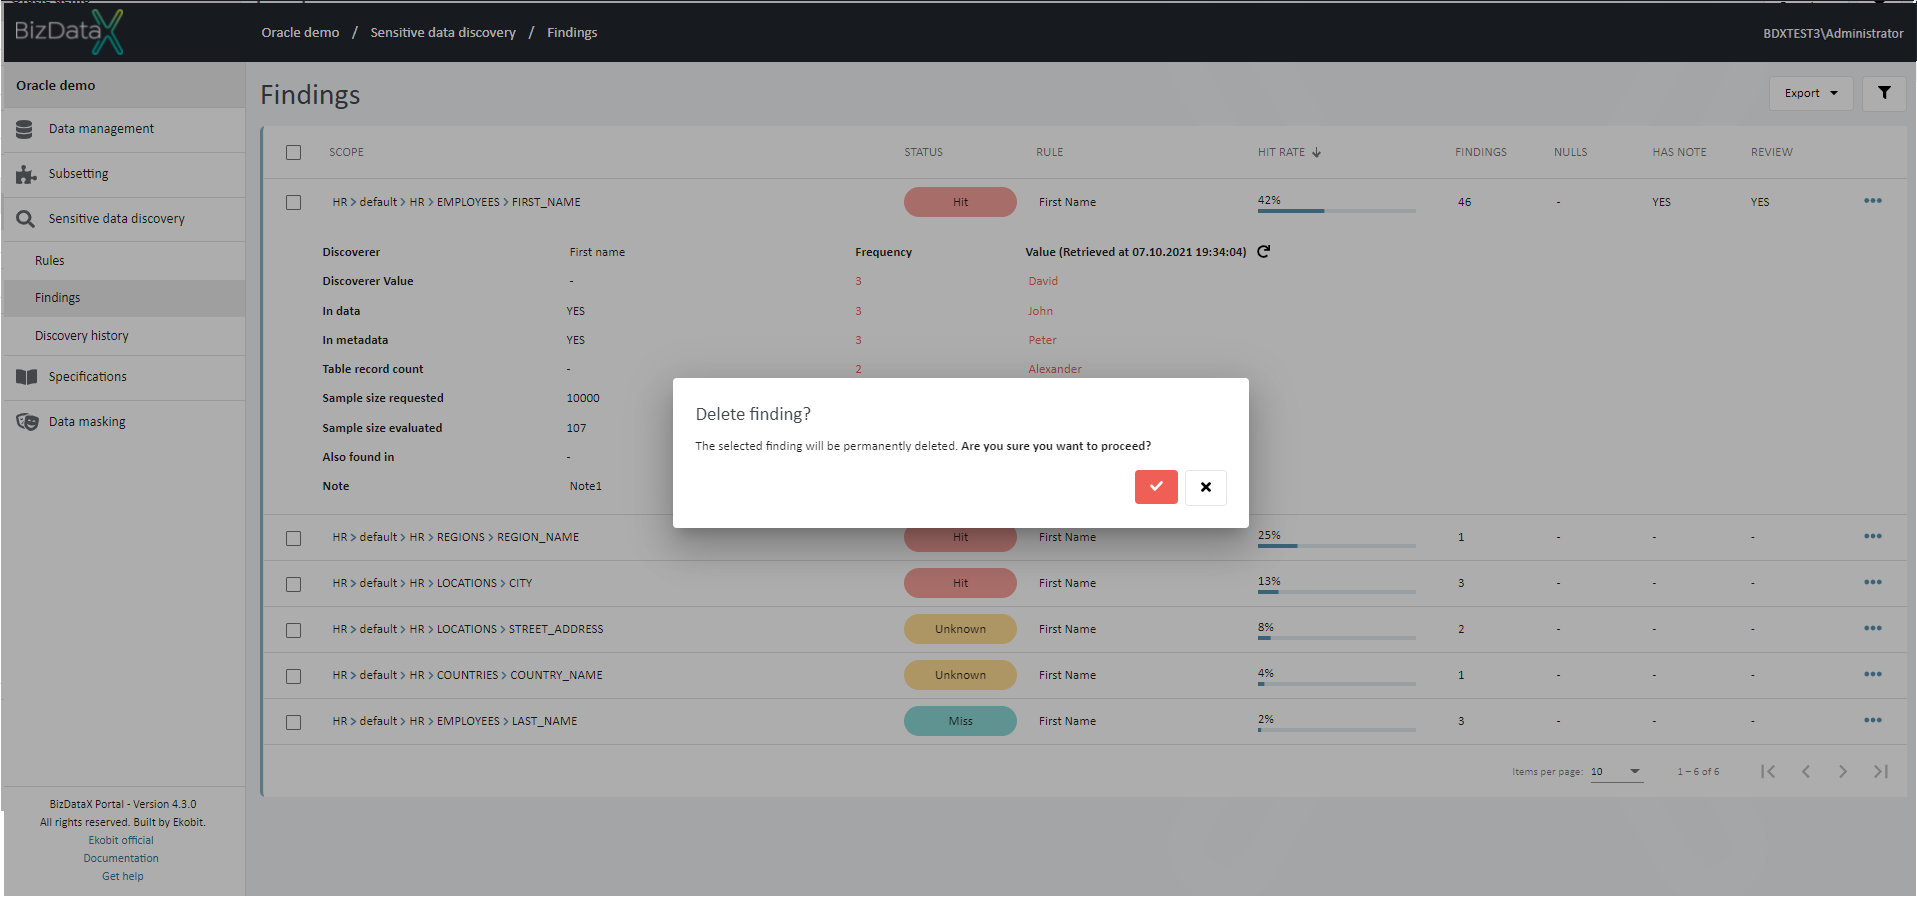 Figure 6: Delete Finding
Reporting
Reporting functionality offers a way to download and manipulate data from Portal in order to produce meaningful reports. Sensitive data discovery finding reports will consist of scope, column record count, finding status, the name of the rule, discoverer and discoverer value used during discovery process, hit rate, evaluated sample size, number of findings, number of null values, information on whether the finding was found inside column data or metadata, information on whether finding should be further reviewed and note.
In addition, reports come in two main types: static files and files with live data feeds.
Static reports
Static files represent raw data snapshot in CSV or Excel format. They can be downloaded using Export button in the top right corner of the data table and choosing Export to CSV or Export to Excel options.
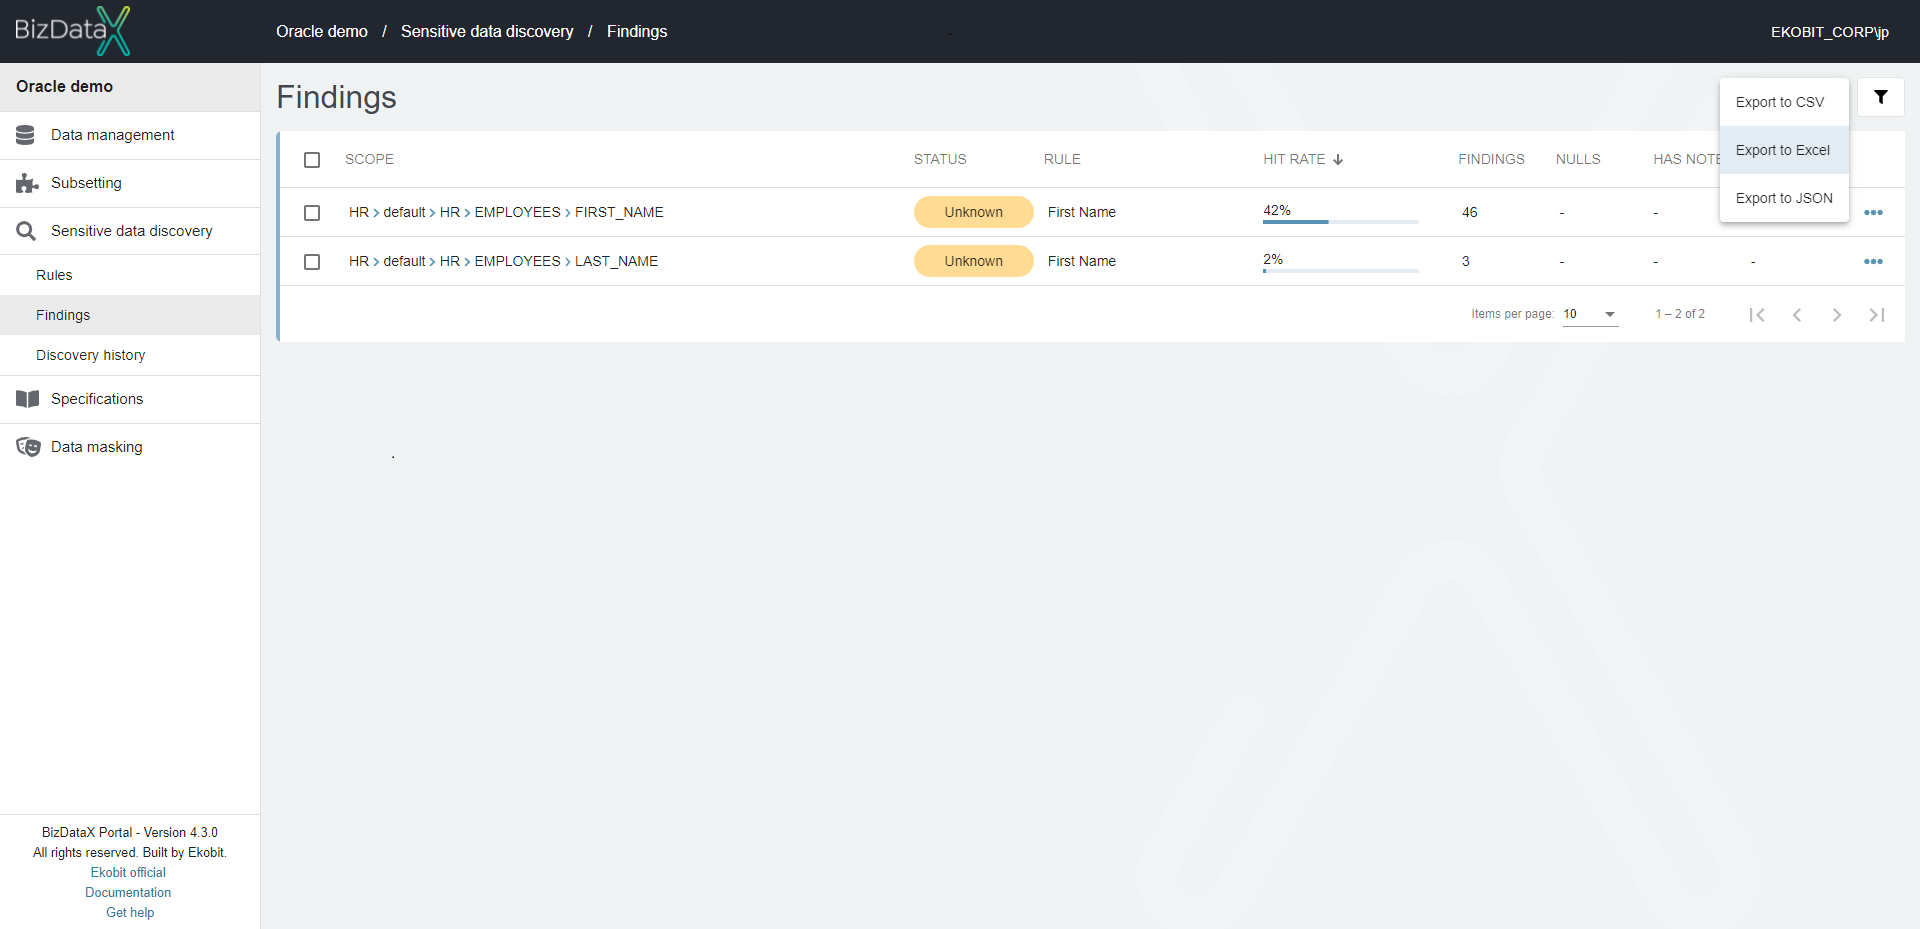 Figure 7: Reporting - export findings
Reports with live data feeds
Files with live data feeds will automatically refresh each time a file is opened, but can also be manually refreshed using Excel. A set of pre-defined reports can be downloaded here. However, custom reports can also be defined using this step-by-step guide:
- Make sure you have Microsoft Excel installed
- Use Portal to find the link for data in JSON format, copy it to clipboard
- The link can be found in the export menu along side the options for downloading files in CSV and Excel formats
- Create a new Excel file
- Navigate to Data tab and select Get Data -> From Other Sources -> From Web option
- A pop-up window will appear, paste the link to JSON data from clipboard
- If Access Web content pop-up window appears, select Windows -> Use my current credentials option
- Power Query Editor will open
- To convert data to table select To Table option and press OK when confirmation dialog appears
- To load partial data use the icon in the header row of the table and deselect information that is of no interest to you
- Press Close & Load option
- Use the loaded data to create custom reports